Python Data Visualizations
Learn Python for data analysis: core Python, NumPy, SciPy, Pandas, Matplotlib and Seaborn, then connect Python with SQL, Power BI and Excel dashboards, with a project every week.
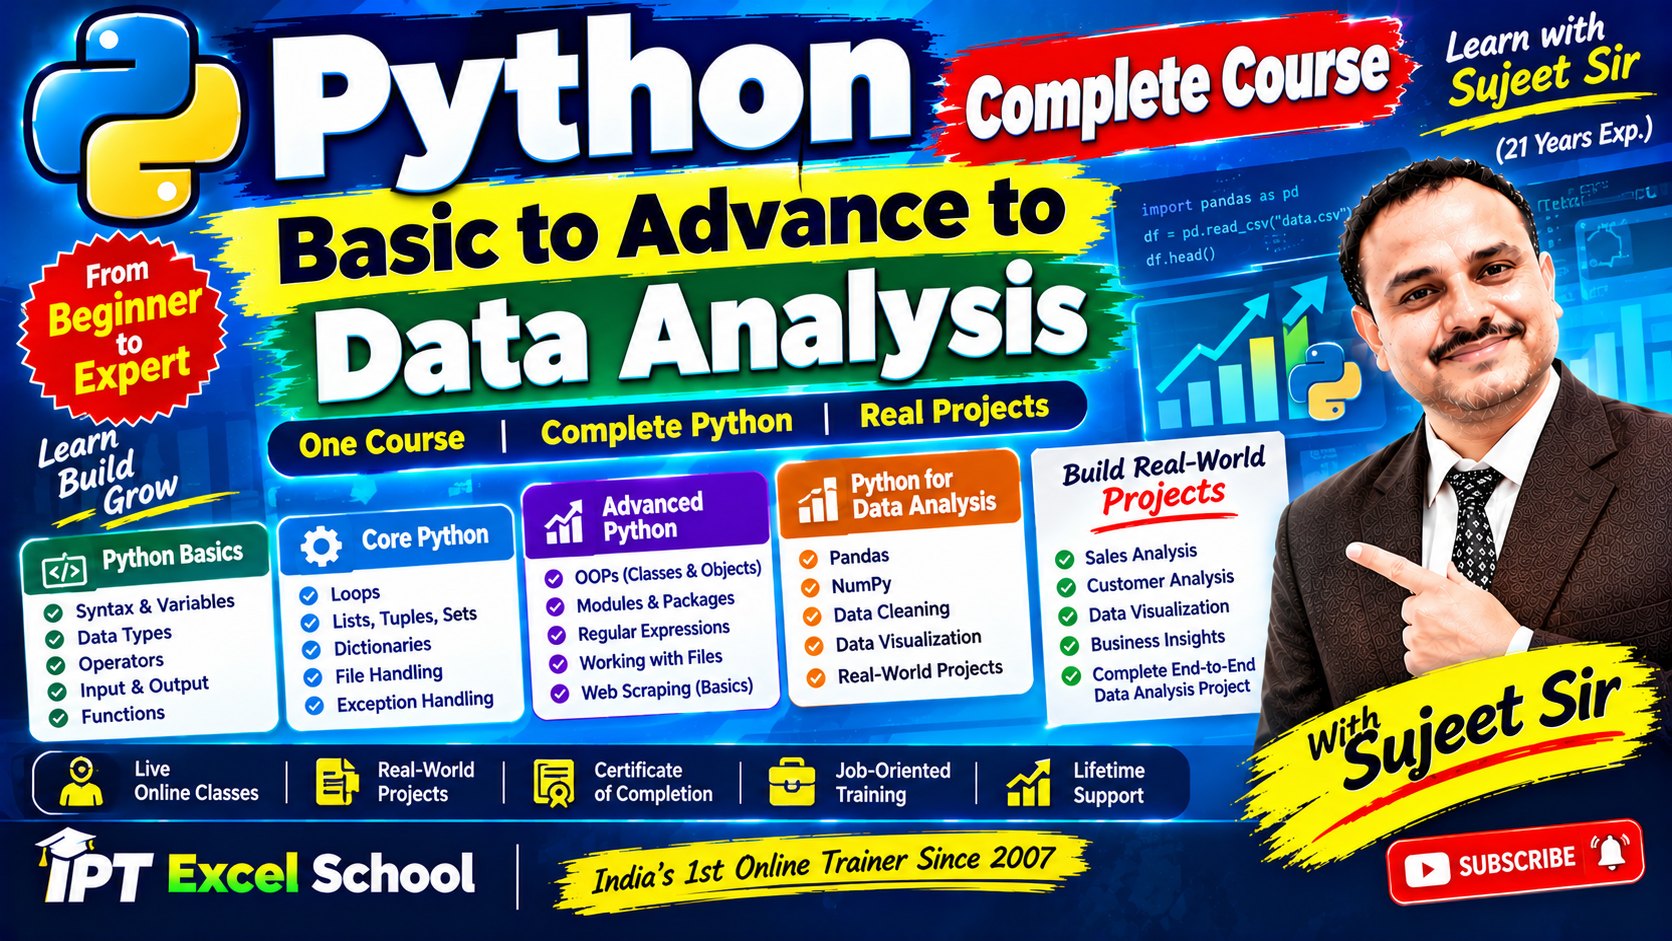
Course highlights

Sujeet Sir
Excel | VBA | Power BI | SQL | Python
Data Analytics Expert & Corporate Trainer
- Sujit Kumar Singh, founder of IPT Excel School since 2007
- Worked as MIS Executive and VBA Developer in 10+ companies
- Reporting consultant for 40+ companies across India
What you will learn
Datatypes, strings, functions, files, regex and 100 programs.
OOP, exceptions, threads, GUI and database connectivity.
The role of Python in analysis and reporting.
Anaconda, NumPy, SciPy, Pandas, Matplotlib, Seaborn.
Arrays, numerical operations and scientific computing.
DataFrames, rows, columns and analysis workflows.
Line, bar, scatter, 2D and 3D, live graphs and Seaborn.
SQLite, Power BI reports and Excel dashboards with PyXLL.
KEY OUTCOMES
- Write and understand Python programs, from basics to advanced concepts
- Work with data using NumPy and Pandas
- Create professional charts with Matplotlib and Seaborn
- Use Python with SQL / SQLite, Power BI and Excel dashboards
YOUR GOAL
Build an end-to-end dashboard from a real dataset and create job-ready reports.
WHO SHOULD LEARN
Beginners and Excel users moving to Python for data analysis.
COURSE OUTLINE
⬇ Download PDFWeek 1 - Python basics for data
Introduction and installation, variables, data types and operators, lists, tuples and dictionaries, if and else, for and while loops. Project: basic data processing script.
Week 2 - Data analysis with Pandas
Introduction to Pandas, reading CSV, Excel and SQL data, cleaning null values and duplicates, filtering and sorting, GroupBy and aggregation. Project: sales data analysis report.
Week 3 - Data visualisation libraries
Matplotlib, line, bar and pie charts, histogram and scatter, Seaborn, styling and themes. Project: dashboard with 5+ charts.
Week 4 - Advanced visualisation and dashboard
Subplots and multiple charts, interactive charts with Plotly, dashboards with Streamlit, two dashboards on a real dataset. Project: interactive dashboard app.
Week 5 - Real projects and automation
Automation with Python scripts, connecting SQL with Python, API data fetching, exporting to Excel, CSV and reports, final end-to-end dashboard.
Modules 1-2 - Python foundation
- Module 1, Core Python : introduction, first program, datatypes, operators, input and output, control statements, arrays, strings, functions, lists and tuples, dictionaries, date and time, files, regular expressions, data structures, 100 small and basic example programs
- Module 2, Advanced Python : OOPs, classes and objects, inheritance and polymorphism, abstract classes and interfaces, exceptions, threads, GUI, networking, database connectivity
Modules 3-6 - Data analytics
- Module 3, Introduction to data analytics : the role of Python, working with data for analysis and reporting
- Module 4, Analytics libraries : Anaconda, NumPy, SciPy, Pandas, Matplotlib, Seaborn
- Module 5, NumPy and SciPy : arrays, numerical operations, scientific computing, mathematical equations and algorithms
- Module 6, Pandas : DataFrames, rows and columns, data storage and manipulation, analysis workflows
Module 7 - Data visualization with Python
- Matplotlib, line graphs, bar charts, scatter plots
- Multiple plots in a graph, 2D and 3D graphs, live graphs
- Seaborn statistical graphics and visualization with Pandas
Modules 8-10 - SQL, Power BI and Excel
- Module 8, Python + SQL : SQL libraries, SQLite, SQL queries with Python, extracting data for analysis
- Module 9, Python + Power BI : Power BI reports and visual charts with Python, Matplotlib and Seaborn visuals
- Module 10, Python + Excel dashboards : Excel dashboards with Python, Pandas for Excel analysis, Python code in Excel, PyXLL integration
Tools and technologies
- Programming: Python · Data analytics: NumPy, SciPy, Pandas
- Visualization: Matplotlib, Seaborn · Database: SQL, SQLite
- Business intelligence: Power BI · Spreadsheet: Microsoft Excel, Pandas, PyXLL · Environment: Anaconda
COURSE DETAILS
| Duration | 5 weeks (25 live classes) |
|---|---|
| Modules | 10 modules and 100 example programs |
| Level | Advanced |
| Class time | Mon to Fri: 1 hour daily, or Sat and Sun: 2-hour classes |
| Batch size | 1 to 3 students (one-to-one or small group) |
| Mode | Live online on Google Meet |
| Language | Hindi or English |
| Projects | 5 weekly projects, ending with an end-to-end dashboard |
| Certificate | Yes, with real project work |
| Support | Phone and Google Meet doubt support |
| Demo | Free 3-4 day demo class |
| Fees | Contact Sujeet Sir: +91 88025 79388 |
HOW IT IS TAUGHT
Live on Google Meet by Sujeet Sir in Hindi or English, with real company examples, projects, a certificate and doubt support on phone after the course.
Join a free demo
Questions about this course
What is the fee of the Python Data Visualizations course?
Fees depend on one-to-one or group batch. Contact Sujeet Sir on +91 88025 79388 or WhatsApp for the current fee.
Is there a free demo?
Yes. Join the 3-4 day free demo before you pay.
Which language is it taught in?
Hindi or English, as you prefer.